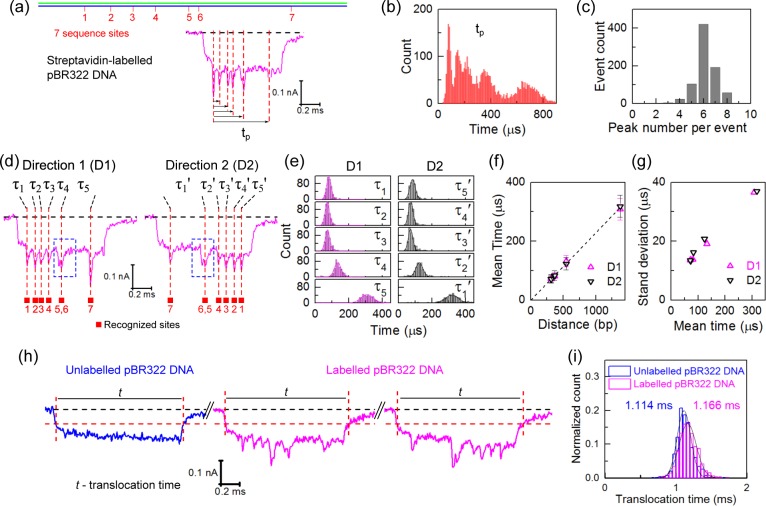
Figure 2.
Analysis of sequence motif positions in linearized pBR322 DNA. (a) An example event showing the time of each peak (tp) measured with respect to the first peak. (b) Histogram of positions of all peaks measured as defined in (a); only direction 1 translocations are considered (N = 812 events). (c) Histogram of number of peaks detected per translocation in direction 1. (d) Example events observed in nanopore measurements showing the two translocation orientations with sites 1 (Direction 1) and 7 (Direction 2) entering first, respectively. Sites 5 and 6 are separated by only 141 bp so that two separate peaks are not fully resolved (marked by the blue dashed box). (e) Histograms of the translocation times (τ1–τ5 and τ5′−τ1′ for only those with translocations with six peaks detected) between adjacent identification sites in two directions obtained from 422 and 432 events, respectively. (f) Translocation time between peaks as a function of label separation distance. The line shows a least-squares linear fit. The times and error bars are the mean values and standard deviations of the Gaussian fits to the histograms in (e). Sites 5 and 6 are regarded as one and the center between them is used. (g) The standard deviation as a function of mean of the Gaussian fit. (h) Example events measured for a mixture of unlabeled and labeled pBR322 DNA; the red vertical lines denote where the translocation begins and ends which we define at −0.06 nA. (i) Comparison between distributions of translocation times (only unfolded events are considered). The mean translocation time is shown. Experiments shown in (a–g) are conducted with a single pore and (h–i) with a second pore.

