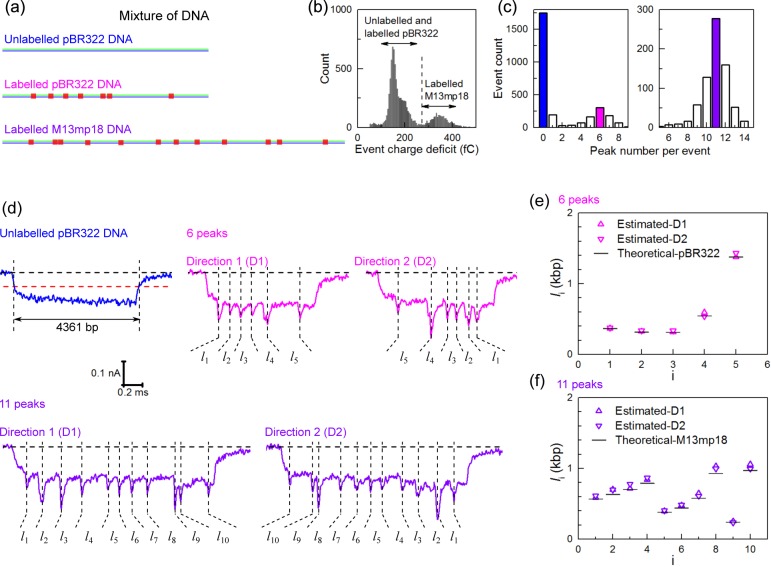
Figure 4.
Detection of multiple DNA molecules in a mixture. (a) The pBR322 DNA, protein-labeled pBR322 DNA (with 7 TCGA sites) and protein-labeled M13mp18 DNA (with 12 TCGA sites) were mixed together. (b) Histogram of the event charge deficit that is approximately proportional to DNA length and shows two populations of pBR322 DNA and M13mp18 DNA. (c) Detected peak number per event for the unfolded events in the left group and right group respectively shown in (b). There are 1752 events with zero peaks and 198 events with one peak showing a false positive peak detection rate of approximately 10% for unlabeled DNA. (d) Example events caused by the mixture. (e) Analysis of distances measured for translocation containing six peaks. The data was transformed from time measurements to distance using the velocity of the unlabeled pBR322 DNA and the value shown is the mean of a Gaussian fit to the distribution. The expected distances are based on the known sequence of pBR322 are also shown. (f) Same analysis as (e) but for only the translocations that show 11 peaks, which is compared with the known separations for M13mp18.

