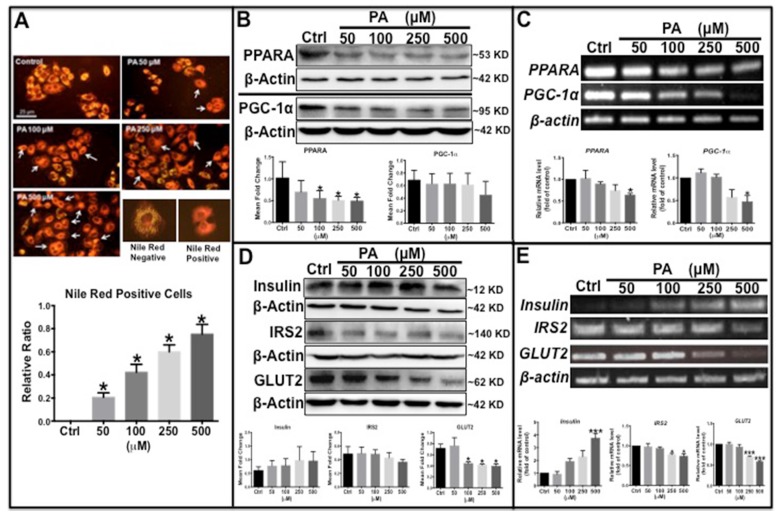
Fig 3.
Palmitic acid induced type 2 diabetes-like features in HepG2 cells. (A) Lipid level was increased in PA concentration-dependent manner in PA-treated cells determined by Nile Red staining. (B) Lipid metabolism-related proteins, PPARα and PGC-1α, were reduced in PA-treated cells. (C) Transcription levels of PPARα and PGC-1α were decreased by PA treatment. (D) Western blot results show that preproinsulin levels increased, and IRS2 and GLUT2 expression decreased in PA-treated cells in a concentration-dependent manner. (E) Transcription levels of insulin elevated and of IRS2 and GLUT2 declined following PA treatment. The upper panel shows representative electrophorogram of the gene bands from RT-PCR and lower panels show the corresponding histograms from real-time qPCR in C and E. *p<0.05, **p<0.01, ***p<0.001 compared with the control group.

