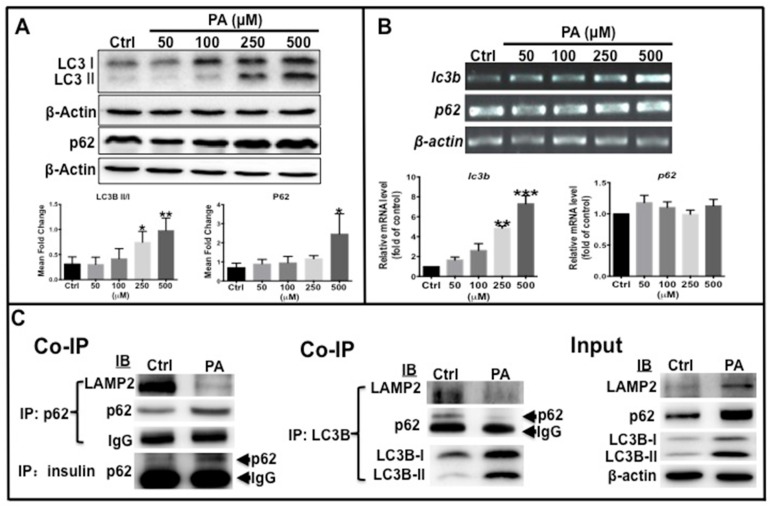
Fig 4.
Autophagy flux was affected by PA treatment. (A) LC3B-II/I ratio, total LC3B and p62 proteins were increased in PA-dependent manner. (B) Transcription levels of lc3b increased, but p62 was unchanged by PA treatment. The upper panel shows representative electrophorogram of lc3b and p62 bands from RT-PCR and lower panels show the corresponding histograms from real-time qPCR. (C) Co-immunoprecipitation (Co-IP) results indicate that there was decreased association of p62 with LAMP2, p62 with LC3B, and LC3B with LAMP2, but an increased association of p62 with preproinsulin in the PA treatment group. *p<0.05, **p<0.01, ***p<0.001 compared with the control group.

