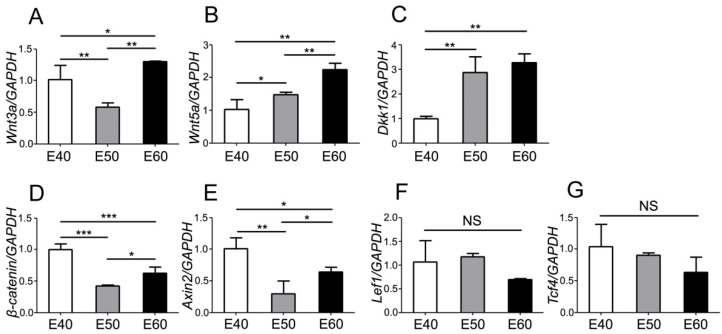
Figure 5.
Quantity of mRNA expression dynamics of Wnt pathway genes during morphogenesis of DM3. mRNA levels were quantified with real-time RT-PCR and the differences were analyzed among three stages of each gene. (A) Wnt3a was expressed at relatively high level at E40 and E60, compared to E50. (B) Wnt5a expression level gradually increased from E40 to E60. (C) Dkk1 expression level gradually increased from E40 to E60. (D) β-Catenin was expressed at relatively high level at E40 and E60, compared to E50. (E) Axin2 was expressed at relatively high level at E40 and E60, compared to E50. (F,G) There were no significant differences of expression level of Lef1 and Tcf4 among different stages. Data presented are mean ± SD. *P< 0.05, **P < 0.01, ***P < 0.001.

