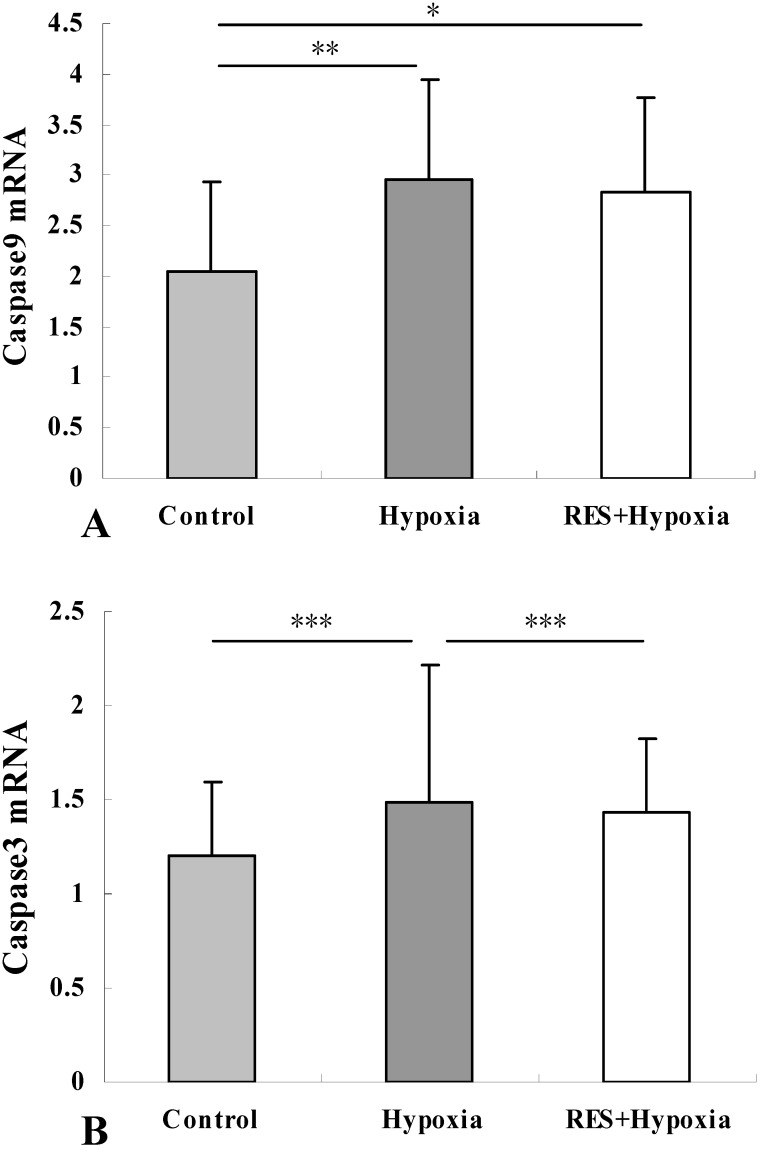
Figure 5.
Caspase9 mRNA (A) and caspase3 mRNA (B) expression in retinas in control, hypoxia and resveratrol invention (RES + Hypoxia) groups. Results are presented as mean ± standard deviation (SD) (n = 6). All experiments were performed at least in triplicate. *P < 0.05, **P < 0.01 and ***P < 0.001.

