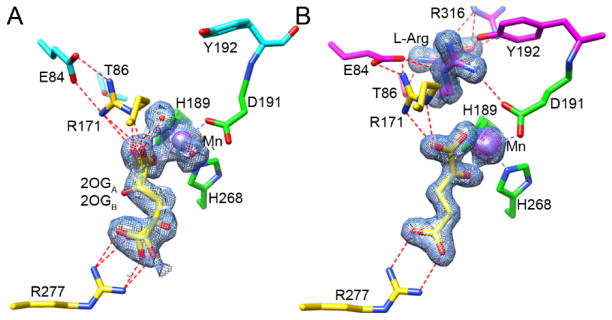
Figure 2.
Active site comparisons of EFE•Mn•2OG and EFE•Mn•2OG•L-Arg. Carbon atoms of the metal-chelating residues are shown in green; 2OG and stabilizing residues are depicted in yellow; L-Arg and its stabilizing residues are illustrated in magenta (these residues are cyan when L-Arg is absent); and water and Mn are shown as red and purple spheres, respectively. The 2FO - FC maps for metal atoms and ligands are shown as blue meshes at 1 σ. The anomalous maps for metal atoms are shown as magenta meshes at 5 σ. Metal chelation is indicated by dashed lines colored the same as the metal, hydrogen bonds are indicated by red dashed lines. (A) EFE•Mn•2OG (1.85 Å). (B) EFE•Mn•2OG•L-Arg (1.43 Å).

