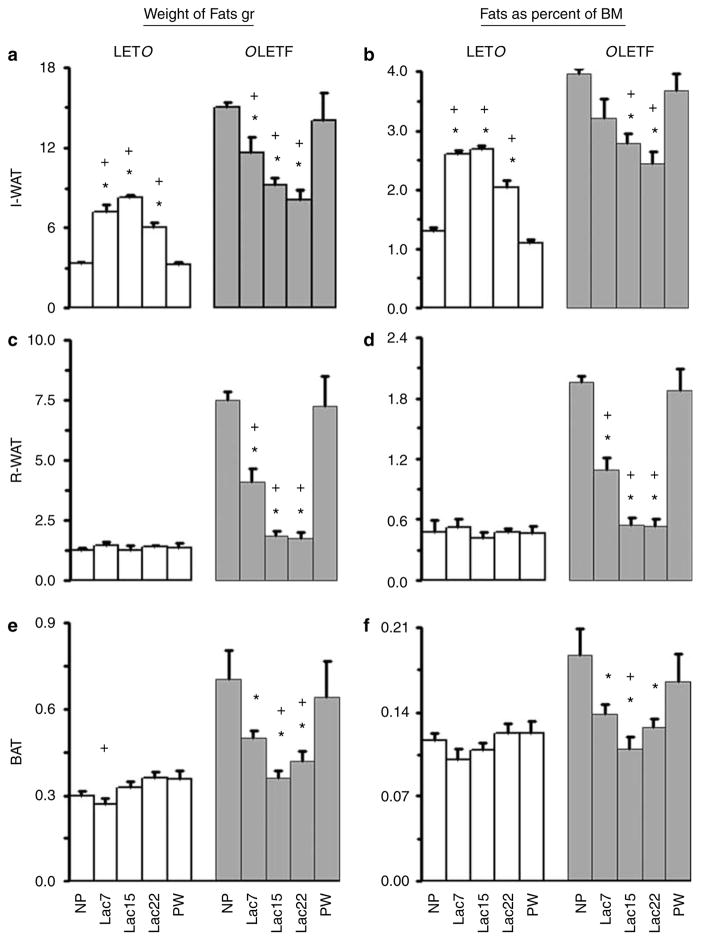
Figure 1.
Adipose fat tissues. Adipose tissues: inguinal WAT (I-WAT) (a, b), retroperitoneal WAT (R-WAT) (c, d) and brown adipose tissue ((BAT) (e, f) were collected and weighed from nulliparous (NP), lactating (Lac7, 15 and WD), and postweaning (PW) rats. The left panel presents the absolute average weight of the fat tissue (a, c and e). The right panel presents the percentage of this tissue from the body mass (b, d and f). Note the similarity of data patterns in the two sets of figures. White bars are Long Evans Tokushima Otsuka (LETO) and gray bars are Otsuka Long Evans Tokushima Fatty (OLETF). At each phase, 5–10 animals were tested and averaged; the error is represented as s.e.m. Analyses of Variance (ANOVAs) performed on the data showed, overall, that the lactating LETO groups had significantly more I-WAT (but not R-WAT and BAT) than the LETO nonlactating groups, whereas in the OLETF strain, the lactating groups had significantly less fat in all three tissues compared to the NP group, and on most comparisons also compared to the PW group. With some exceptions, fat tissue weight did not differ significantly among the lactating groups. OLETF–LETO comparisons: OLETF dams had significantly heavier fat pads and greater percent fat on all measures, in NP, PW and Lac7 dams (with a few exceptions). In contrast, on Lac15 and 22, the two strains did not differ on all measures (with one exception). For particular group comparisons, see ‘Results’. *, Significantly different from NP group, within-strain comparison and +, significantly different from PW group, within-strain comparison.

