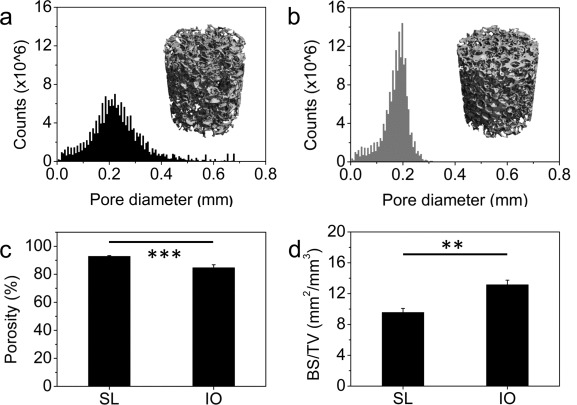
Figure 2.

Pore diameter distribution and a representative 3D reconstruction of salt‐leached scaffolds (a) and inverse opal scaffolds (b) as determined by microCT measurements. Porosity (c) and scaffold surface area normalized by the total scaffold volume (d) calculated from the scans for salt‐leached and inverse opal scaffolds. *p < 0.05, **p < 0.01, ***p < 0.001.
