Figure 7.

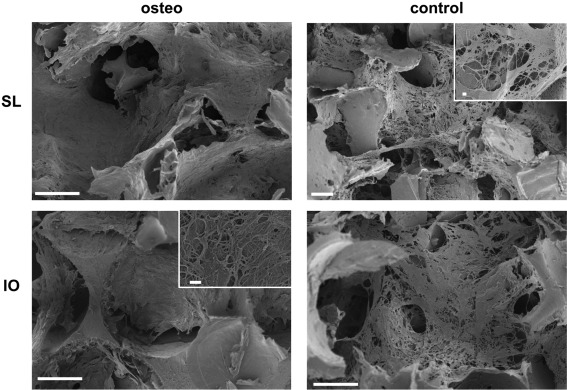
SEM images of salt‐leached and inverse opal SF scaffolds after 6 weeks in culture in osteogenic and control medium. Representative insets show tissue morphology. Scale bars 100 μm, scale bars in insets 1 μm.

SEM images of salt‐leached and inverse opal SF scaffolds after 6 weeks in culture in osteogenic and control medium. Representative insets show tissue morphology. Scale bars 100 μm, scale bars in insets 1 μm.