Figure 3.

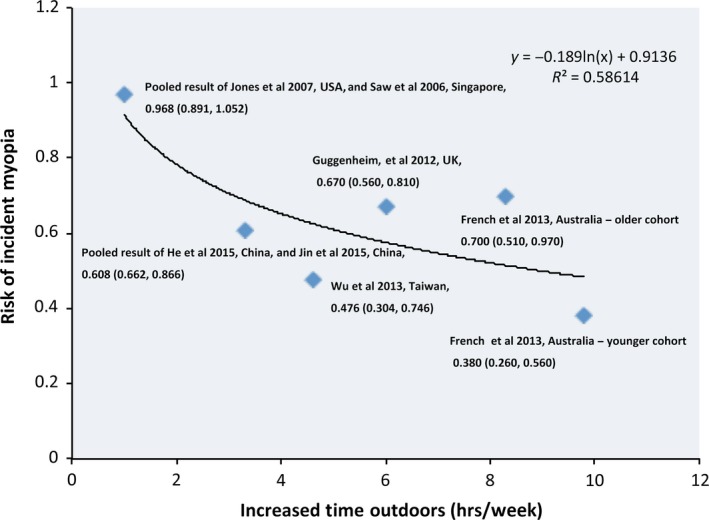
Dose–response analysis of the time spent outdoors and the risk of myopia (y: risk ratio; and x: increased time spent outdoors). [Colour figure can be viewed at wileyonlinelibrary.com].

Dose–response analysis of the time spent outdoors and the risk of myopia (y: risk ratio; and x: increased time spent outdoors). [Colour figure can be viewed at wileyonlinelibrary.com].