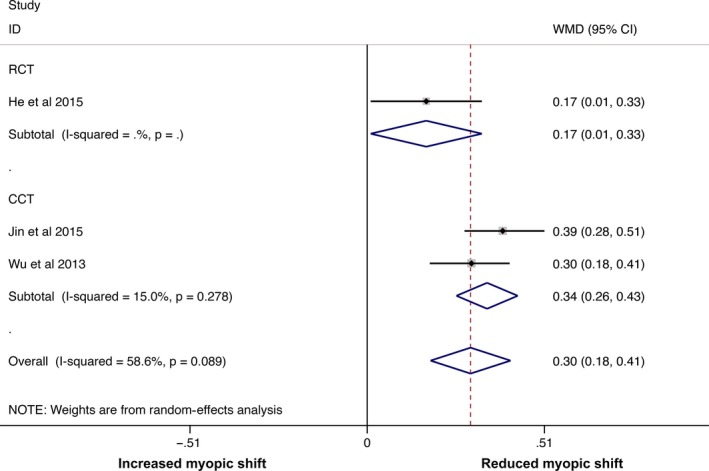
Figure 5.

Forest plot corresponding to main random‐effects meta‐analysis performed to quantify the mean difference in myopic shift in refraction in the whole sample between the intervention group, with increased time spent outdoors, and the control group. All statistical tests were two‐sided. CI = confidence interval, and WMD = weighted mean difference. [Colour figure can be viewed at wileyonlinelibrary.com].
