
Figure 10.
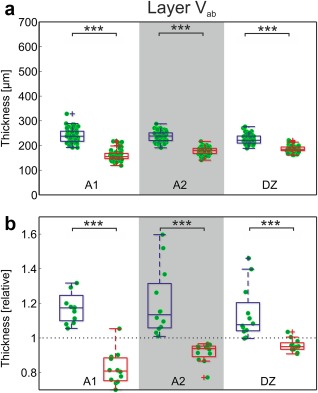
SMI‐32 reveals thinner layer Va+Vb in deaf animals. (a) Direct comparison of the measurements in absolute data (A1: p = 3.59*10−19; A2: p = 8.71*10−20; DZ: p = 2.44*10−13; Bonferroni‐corrected two‐tailed Wilcoxon–Mann–Whitney test). (b) Normalized results. Mean data from each section in auditory cortex were divided by the corresponding mean result in area 7. In hearing controls, the auditory cortex layer Vab is thicker than area 7; in deaf animals, the auditory cortex is thinner (A1: p = 3.66*10−5; A2: p = 3.66*10−5; DZ: p = 9.73*10−5; uncorrected). Blue: hearing cats; red: congenital deaf cats. *** ∼p< 0.001