
Figure 6.
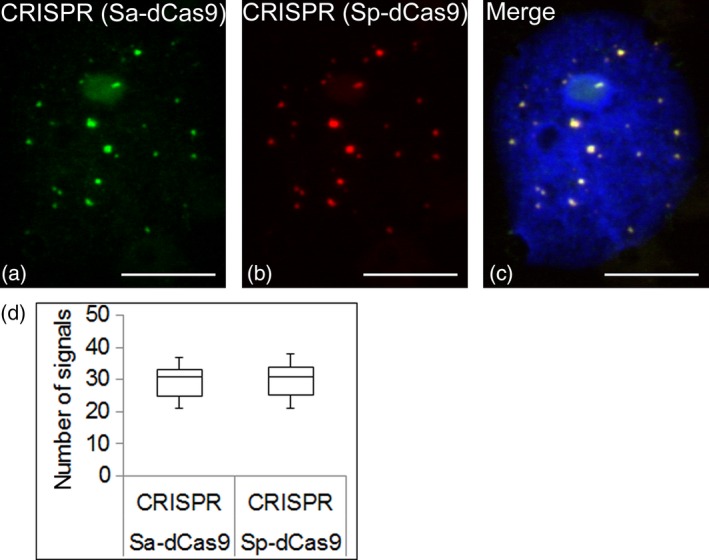
Comparison of Sa‐dCas9 and Sp‐dCas9. Telomeres were visualized by the simultaneous application of two dCas9 orthologues (Sa‐dCas9 and Sp‐dCas9). (a) Immunofluorescence staining against Sa‐dCas9‐eGFP. (b) Immunofluorescence staining against Sp‐dCas9‐mRuby2. (c) Overlay showing complete co‐localization. Nucleus is counterstained with DAPI (in blue). (d) Quantification of the number of telomere signals observed by two different dCas9 orthologues (n = 18). Scale bars: 10 μm.