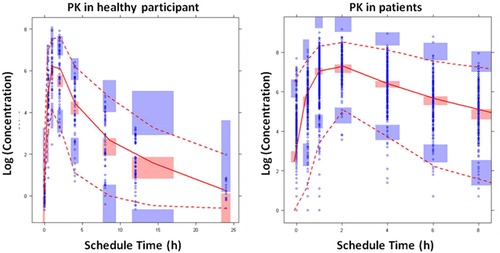
Figure 2.

Visual predictive checks for the time profiles of CC‐292 concentrations (all dose levels). Blue circles represent observed data. Lines represent the 5th (dashed), 50th (solid), and 95th (dashed) percentiles of the observed data. Shaded areas represent nonparametric 95% confidence intervals about the 5th (blue), 50th (pink), and 95th (blue) percentiles for the corresponding model‐predicted percentiles.
