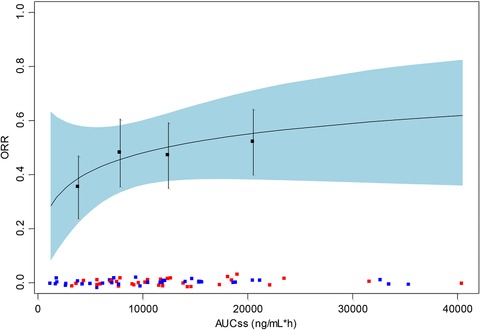
Figure 3.

Logistic regression of the probability of overall response vs AUCss. Black line indicates the predicted response. Light blue ribbon indicates 95% confidence interval of predicted response. Black solid squares and vertical error bars indicate mean and 95% confidence interval for the observed response rate within each quartile of exposure. Individual exposure values are shown as colored squares (red squares represent responders and blue squares represent nonresponders). AUCss indicates area under the concentration‐time curve at steady state.
