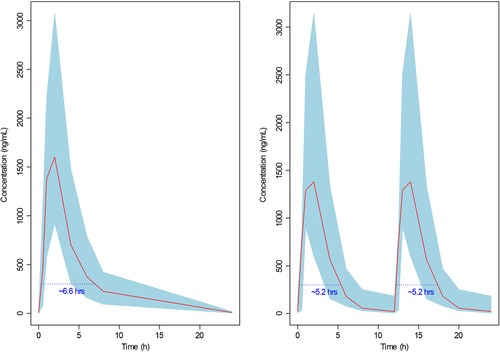
Figure 4.

Duration above the threshold concentration from the same total daily dose: 750 mg QD (left) vs 375 mg BID (right). Solid red lines represent the mean of observed concentration data. Shaded areas represent 90% confidence intervals of observed concentration data. Dotted blue lines represent the threshold concentration of 300 ng/mL. Blue numbers represent the duration above the threshold concentration. QD indicates once daily; BID, twice daily.
