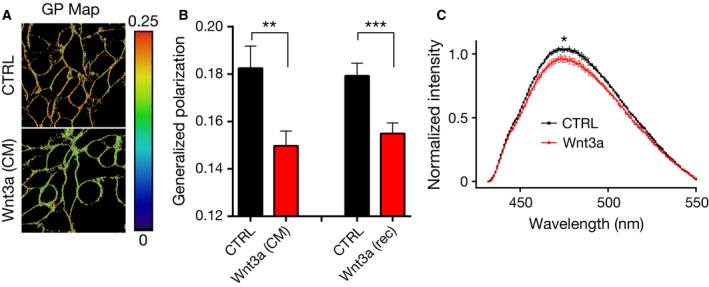
Figure 2.

Plasma membrane order is altered upon canonical Wnt stimulation. (A) Representative generalized polarization (GP) maps in the plasma membrane of HEK293T cells treated with either control‐ (top) or Wnt3a‐conditioned media (CM) (bottom) using the polarity sensitive dye Di‐4‐AN(F)EPPTEA and confocal microscopy in combination with spectral detection (large GP values indicate high membrane ordering; red in the color scale). (B) Average and standard deviation (error bars) of GP values determined from 10 images (each image contained multiple cells) for both Wnt3a CM and Wnt3a rec. (C) Average and standard deviation (error bars, three independent experiments) of fluorescence emission spectra of SL2 in HEK293T cells treated with either control‐conditioned (black) or Wnt3a‐conditioned (red) media (for panel C, P value was determined using the intensity at λ = 475 nm). Statistical significance was determined using unpaired t‐test. ***P < 0.001, **P < 0.01, *P < 0.05.
