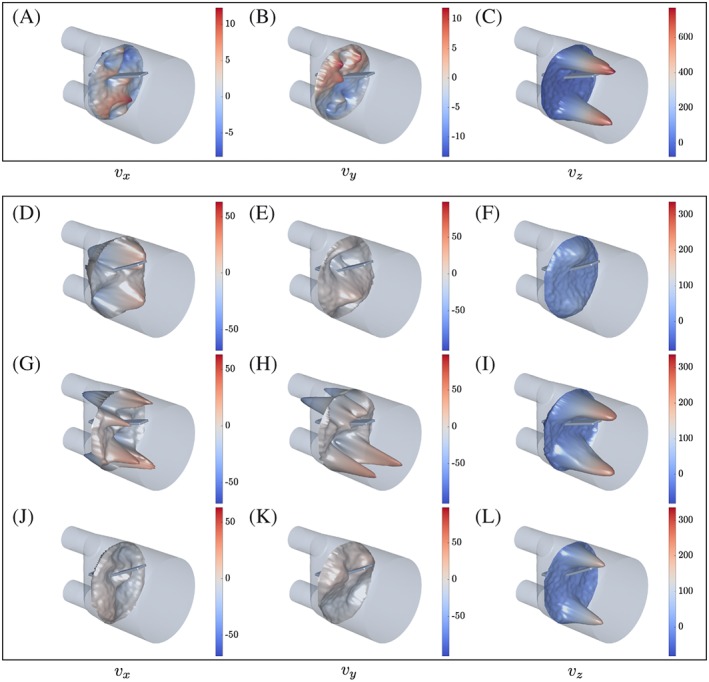
Figure 5.

Recorded flow velocity components for A to C phase I at z ≈ 30 mm, and D to L phase II at z ≈ 33 mm, t ∈ {0.721, 1.153, 2.665} s. Velocity components v x are given in the left column, v y in the middle column, and v z in the right column. Note that data points d i are shown at displaced coordinates d i + [v x, v y, m·v z]T·1s with m = 0.07 and m = 0.2 for phases I and II, respectively
