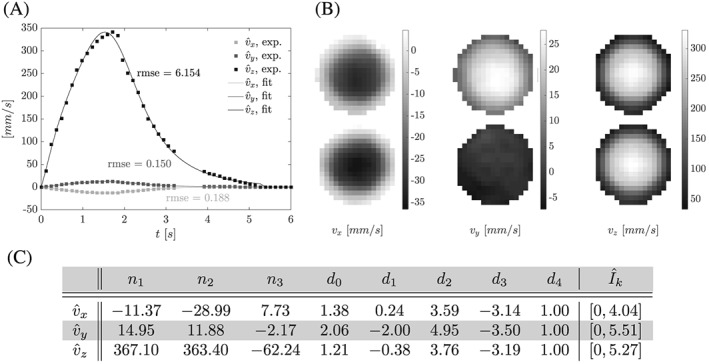
Figure 6.

Phase II, recorded inflow boundary condition data. A, Recorded peak inflow and fit curves, see C. B, Raw image data (cropped at flow phantom wall) of inlet velocity profiles at peak inflow. C, Coefficients for for , k ∈ {x, y, z}, fit to recorded peak inflow with for . Note that flow in the v y direction was observed only in the upper inlet
