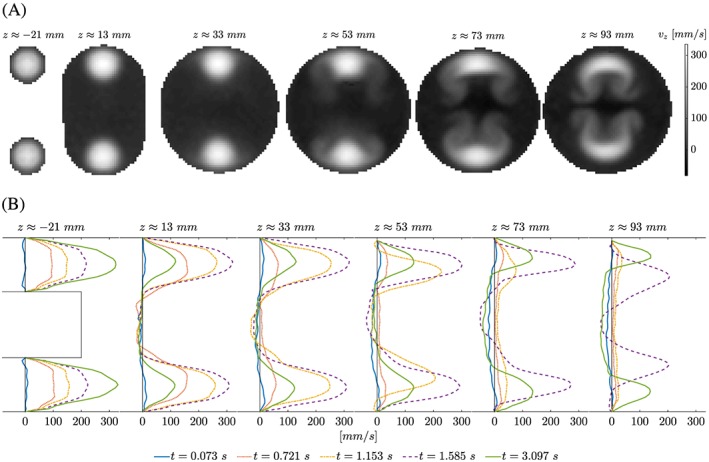
Figure 7.

Phase II, flow velocity component v z at z ≈ { − 21,13,33,53,73,93} mm. A, Raw image data (cropped at flow phantom wall) of flow jets entering the FSI section at the two inlets create a double Ω‐shaped flow pattern downstream at time t ≈ 2.017 s. B, At x = 0 mm (midplane), velocity profiles are shown for multiple time frames. It is noted that peak values of flow are observed at different time instants and that reflow regions develop near the long axis of the flow phantom model
