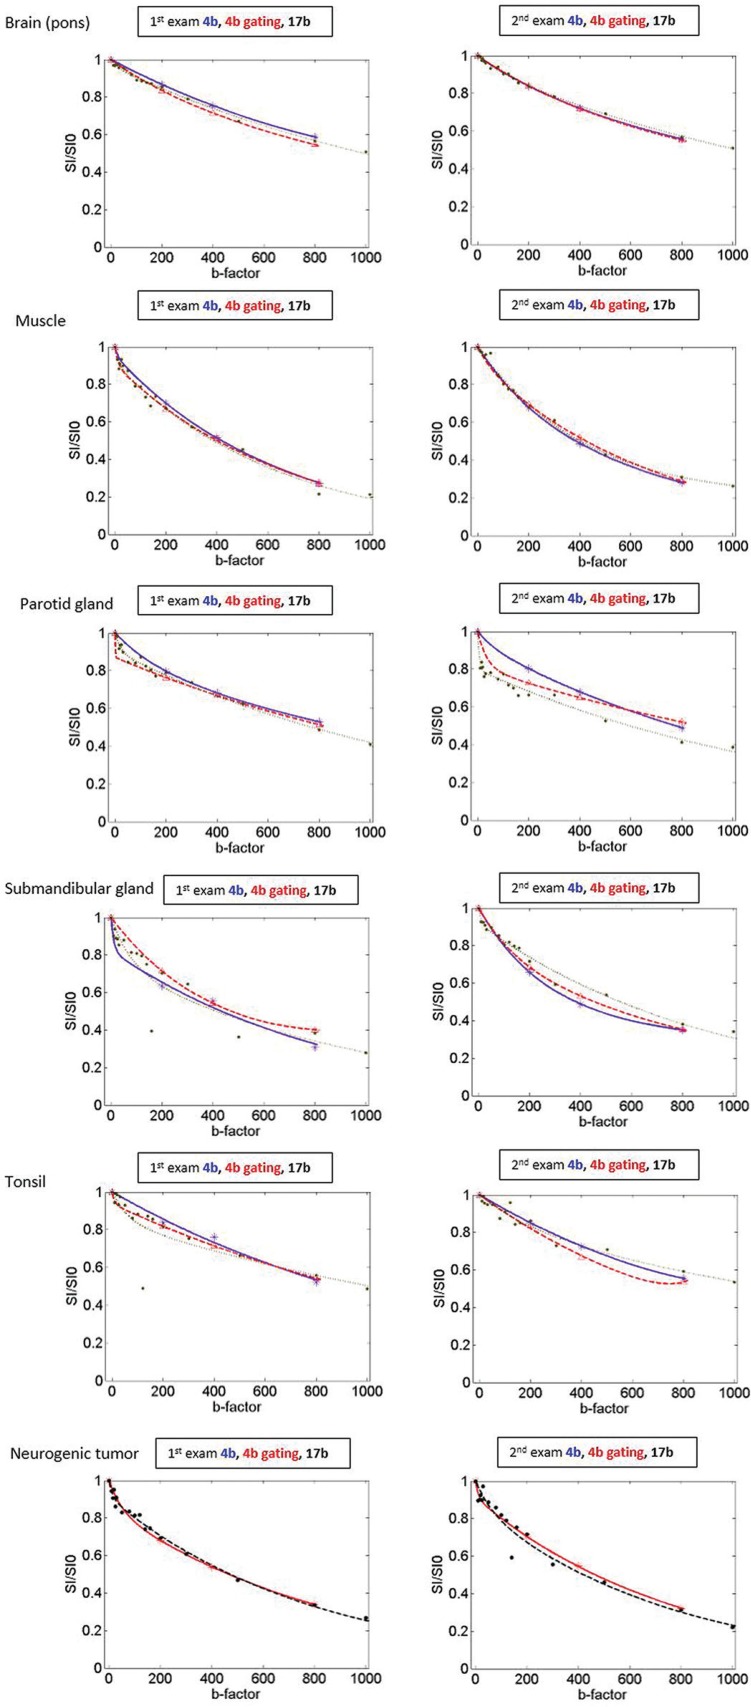
Fig 4.
Fitted curves comparing 4b, 4b gating and 17b in the normal head and neck tissues and 4b gating and 17b in a neurogenic tumor in the left level II. The blue, red, black dots and line indicate the data points and fitted curves of 4b, 4b gating and 17b, respectively. Not only the fitted curve of 17b, but also the fitted curves of 4b and 4b gating revealed different shape of biexponential curves according to the perfusion characteristics of the normal tissues and head and neck masses. For example, the fitted curves of the brain and muscle show flattening whereas the fitted curves of the parotid gland and submandibular gland seem to be initially steeper decreased.

