Fig 3.

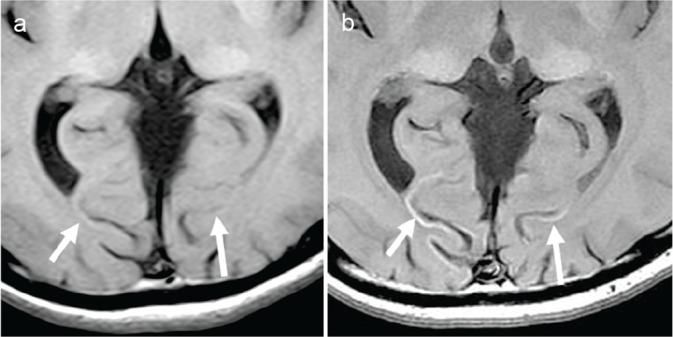
T1-weighted images at the level of the calcarine sulcus. High-signal intensity is more apparent on the 2014- (b) than the 2003 (a) image (arrows).

T1-weighted images at the level of the calcarine sulcus. High-signal intensity is more apparent on the 2014- (b) than the 2003 (a) image (arrows).