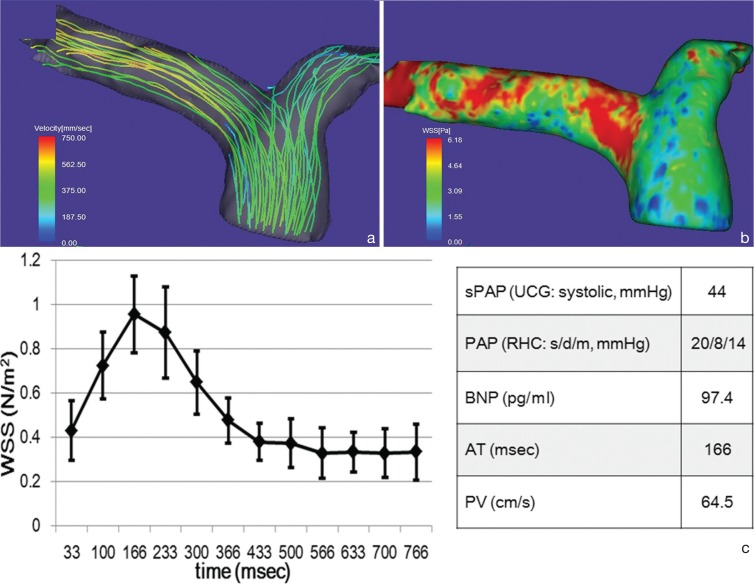
Fig. 2.
Representative streamline analysis (a), WSS map (b), time course changes of the WSS values of the main pulmonary arterial wall and hemodynamic values (c) acquired in a 77-year-old male with non-PAH. Systolic streamlines of the pulmonary artery (a) show laminar, but no vortex flow. WSS in the time-averaged WSS-contour image of the pulmonary artery (b) is about 3 N/m2 or more. Spatially-averaged temporal WSS change in the pulmonary artery (c) show its peak at 166 ms from R wave (systole). Patients’ data with non-PAH demonstrates a high value of BNP and normal PAP. The error bars represent the SD. AT, acceleration time; BNP, brain natriuretic peptide; PAH, pulmonary arterial hypertension; PAP, pulmonary arterial pressure; PV, peak velocity; RHC, right heart catheterization; s/d/m, systole/diastole/mean; sPAP, systolic pulmonary arterial pressure; UCG, ultrasound cardiography; WSS, wall shear stress.

