
Figure 1.
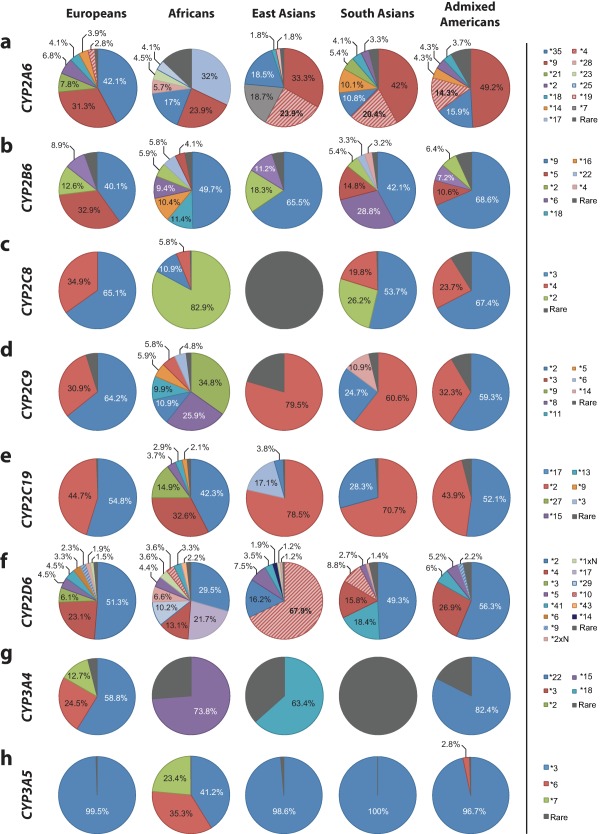
Distribution of the relative contributions of major cytochrome P450 (CYP) alleles in European, African, Asian, and American populations. Pie charts showing the relative contribution of common variants in CYP2A6 (a), CYP2B6 (b), CYP2C8 (c), CYP2C9 (d), CYP2C19 (e), CYP2D6 (f), CYP3A4 (g), and CYP3A5 (h) in five major populations. Only variants with a minor allele frequency in the respective population above 1% are shown, whereas all other variants analyzed in this study are summarized as “rare” (grey).