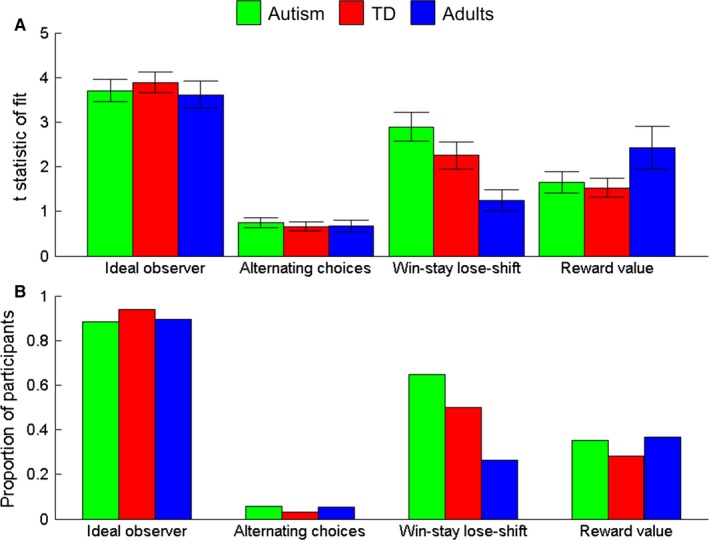
Figure 4.

Results of model fitting to participant data. (A) Mean t‐statistic of fit for four models to the data of autistic children (green), typically developing (TD) children (red), and typical adults (blue): (1) an ideal observer model, (2) a model which alternates between responses trial‐by‐trial, (3) a win‐stay lose‐shift model (maintaining responses after successes and switching responses after failures), and (4) a model based on the reward value. Error bars represent ±1 standard error of the mean. (B) Proportion of participants in each group whose data were significantly fit with each of the four models (p < .05).
