
Figure 1.
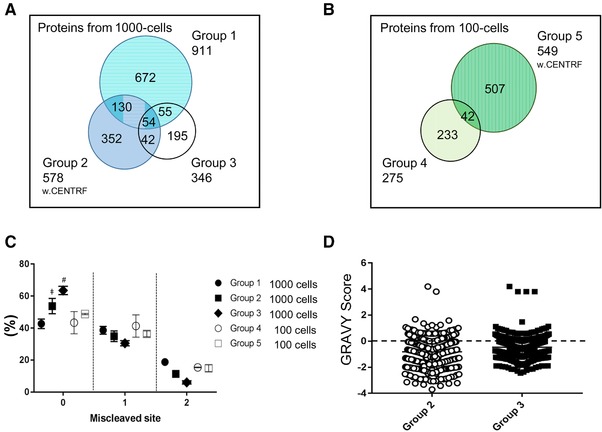
Microproteome profiling and characteristics (A) Proteins identified from 1000‐sorted cells: Group 1: BSA‐coated tube digested with medium; Group 2: BSA‐coated tube with the medium removed; Group 3: hydrophilic‐coated tube with the medium removed (B) Proteins from 100‐sorted cells: Group 4: BSA‐coated tube digested with medium; Group 5: BSA‐coated tube with the medium removed. w. CENTRF: with centrifugation (C) Miscleaved peptide sites under each condition. Some error bars are invisible because of low variability. Unpaired T‐test: ǂ, Group 1 vs. Group 2, p< 0.05, #, Group 1 vs. Group 3, p< 0.01 (D) Distribution of the peptide GRAVY score from 1000‐sorted THP‐1 cells in BSA‐coated or hydrophilic‐coated tubes. (N = 3).