
Figure 2.
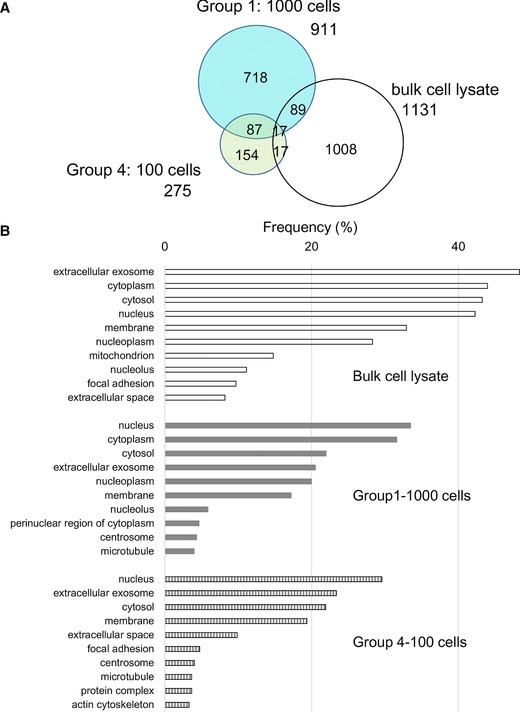
Proteome profiling in micro‐ and conventional proteomics (A) Venn diagrams comparing the proteins or peptides identified from 1000‐sorted cells, 100‐sorted cells or bulk cell lysate. (Groups 1, 4 and bulk cell lysate) (B) GO analysis of cellular components for the proteins identified from bulk cell lysate (open), 1000‐sorted cells (Group 1, gray) and 100‐sorted cells (Group 4, striped). The results are shown as the frequency (%) of the top ten GO terms in each group.