Figure 2.

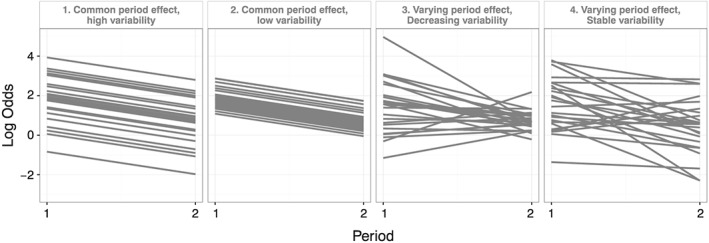
Simulated cluster‐level log odds in each period effect scenario. A sample of 25 clusters is shown in time periods 1 and 2. All are in control condition.

Simulated cluster‐level log odds in each period effect scenario. A sample of 25 clusters is shown in time periods 1 and 2. All are in control condition.