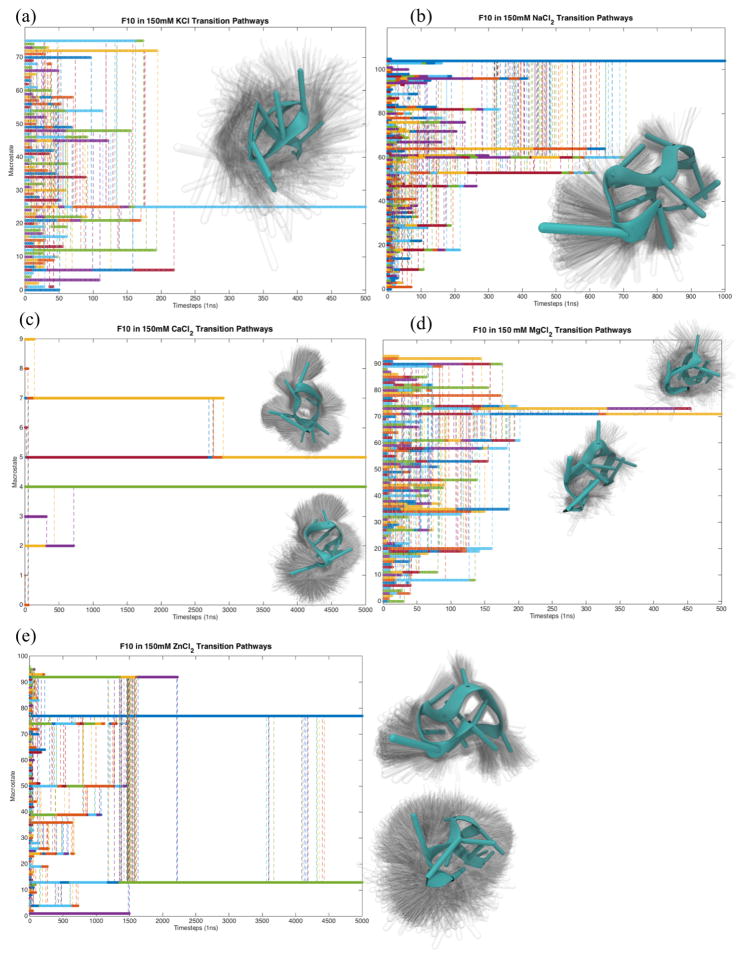
Fig. 3.
Calculating transitions between structural macrostates using Markov analysis (see Methods) indicates each system has one or two kinetic traps on a microsecond timescale. The conformational ensemble comprising the longest-lived one or two states. For systems where two states are visualized in this figure, the ensemble is placed closest (vertical distance) to line on the plot representing that state. The plots of Macrostate vs Timestep were constructed by simulating a system starting from each macrostate (y-tick value) directly from a Markov Rate Matrix. The rate matrix made using a lag time of 1ns is exponentiated over natural number values, and whenever a transition becomes more than 50%, that transition is considered to have occurred. Vertical dotted lines represent the point at which a transition occurs. The color of each vertical line corresponds to its starting state.

