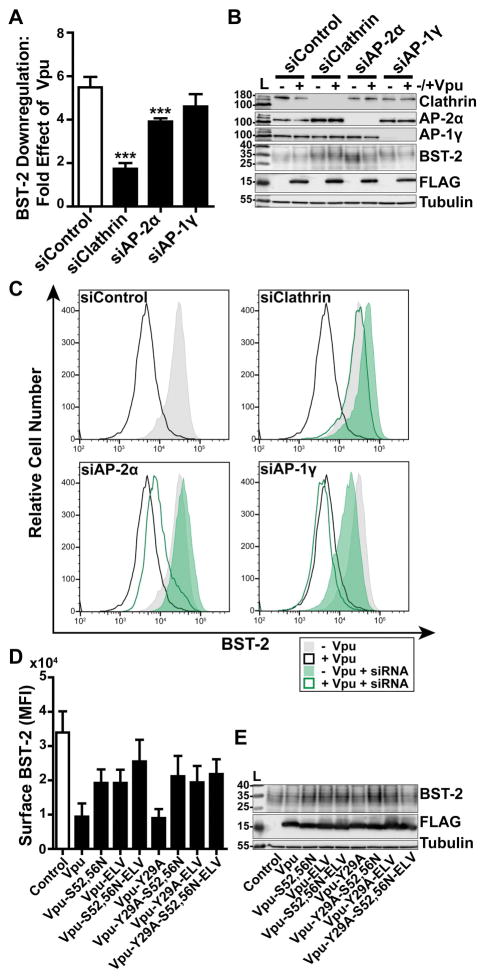
Figure 6. Clathrin and AP-2 are required for optimal Vpu-mediated downregulation of cell-surface BST-2.
(A) Vpu-mediated downregulation of surface BST-2 was measured in cells depleted of Clathrin, AP-2α, or AP-1γ subunits. HeLa-P4.R5 cells were transfected with the indicated siRNA oligonucleotides and after 48 hours co-transfected with either empty control plasmid or Vpu-FLAG plasmid, and a GFP expression construct. Surface BST-2 was labeled using fluorophore-conjugated anti-BST-2 antibody and analyzed by two-color flow cytometry. Data presented are the fold effect of Vpu on BST-2 in the presence of the indicated siRNAs. Error bars indicate the standard deviation of four independent experiments. P-values were generated by one-way ANOVA with Bonferroni post hoc test, *** indicates P <0.001. (B) Depletion of Clathrin, AP-2α, and AP-1γ was measured in cell lysates by SDS-PAGE and Western blotting. (C) Representative histograms of fluorescence intensity of BST-2 staining in the GFP-positive cell populations. Shaded histograms represent cells not transfected to express Vpu; unshaded represent cells transfected to express Vpu. The siControl profiles are superimposed on the profiles from the knockdown conditions to facilitate comparisons. (D) Surface BST-2 downregulation was measured in cells transfected to express Vpu-FLAG bearing single or combination mutations S52,56N, ELV/AAA, and Y29A. HeLa P4.R5 cells were co-transfected with either empty plasmid or plasmid expressing the indicated Vpu-FLAG mutants, and a GFP expression construct. The following day, the cells were stained for surface BST-2 and analyzed by two-color flow cytometry. Data presented are the mean fluorescence intensity of BST-2 in the GFP-positive cell population. Error bars indicate the standard deviation of three independent experiments. (E) Cell lysates were subject to SDS-PAGE and western blotting.

