
Figure 2.
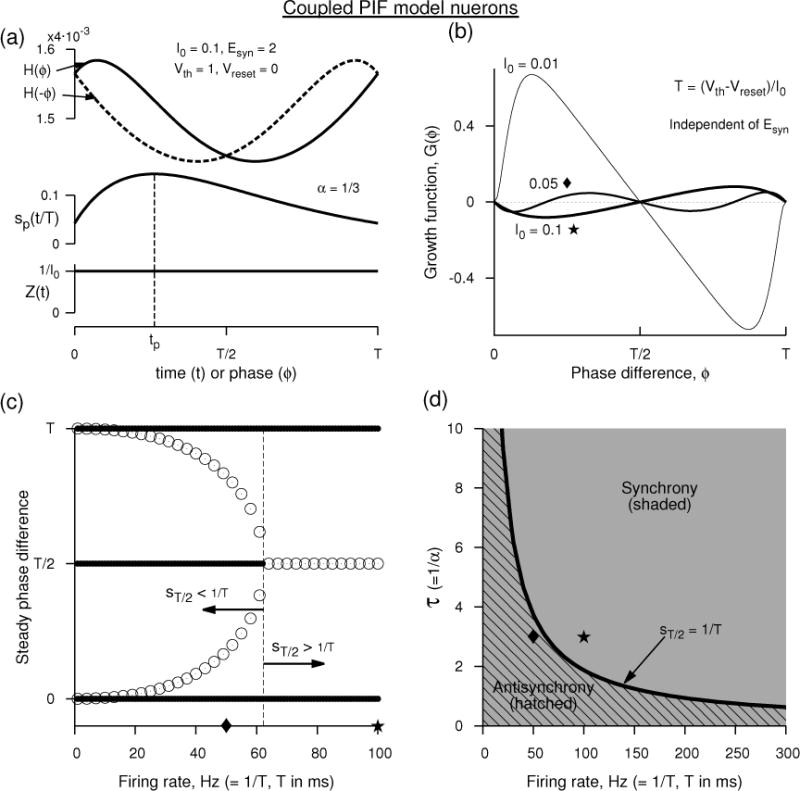
Analytical prediction of synchrony and anti-synchrony between two perfect integrate-and-fire neuron models. (a) The interaction function H(ϕ) and the alpha-function synaptic conductance at an Esyn that makes the coupling excitatory. The PRC of the model is simply 1/Iapp. (b) The growth function G(ϕ) at three different Iapp. G(ϕ), the phase-locked states and their stability are independent of Esyn, and thus the panels (b–d) remain unaltered between excitatory and inhibitory couplings. (c) The steady phase differences as a function of the frequency displaying stable synchrony (filled circles resembling thick lines at ordinate values of 0 and T) at all frequencies, stable antisynchrony (filled circles at T/2) at low frequencies. The unfilled circles represent unstable steady state phase differences. (d) Parameter display of synchrony (shaded, filling all the space) and antisynchrony (hatched) in the space of synaptic time constant τ (= 1/α) and firing rate (= 1/T). Unit of ms is assigned to time for convenience.