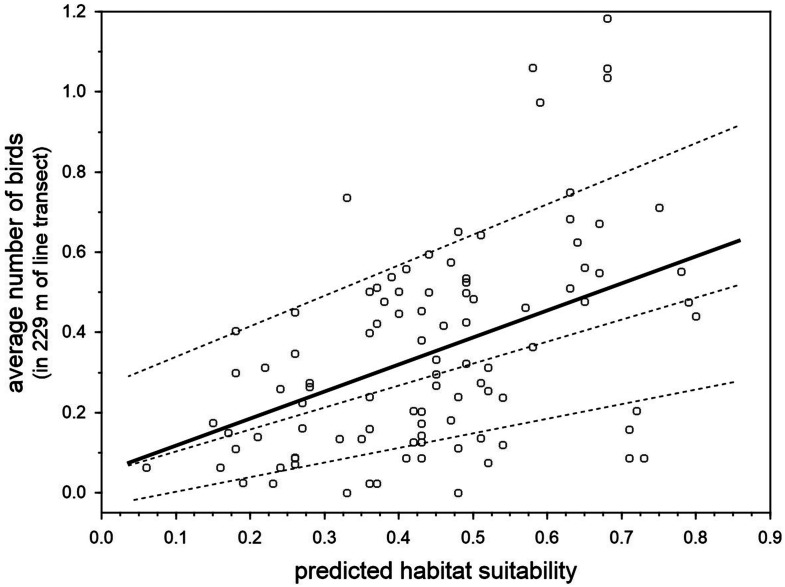
Figure 5. Relationship between the predicted breeding habitat suitability of BCT models and the average number of blue chaffinches counted during the breeding season in 100 transect units of 229 m along the same 22.9 km survey trail in Inagua reserve during 15 years (1994–2006 and 2011–2016 in those years when the pine forest was not affected by the devastating forest fire of July 2007).
The thick line shows the partial OLS regression slope, and the three dashed lines the regression slopes for 90%, 50% and 10% quantile regressions, after controlling by three spatial filters obtained by means of spatial eigenvector mapping (i.e., the residuals of models do not manifest statistically significant spatial autocorrelation according to Moran’s I).

