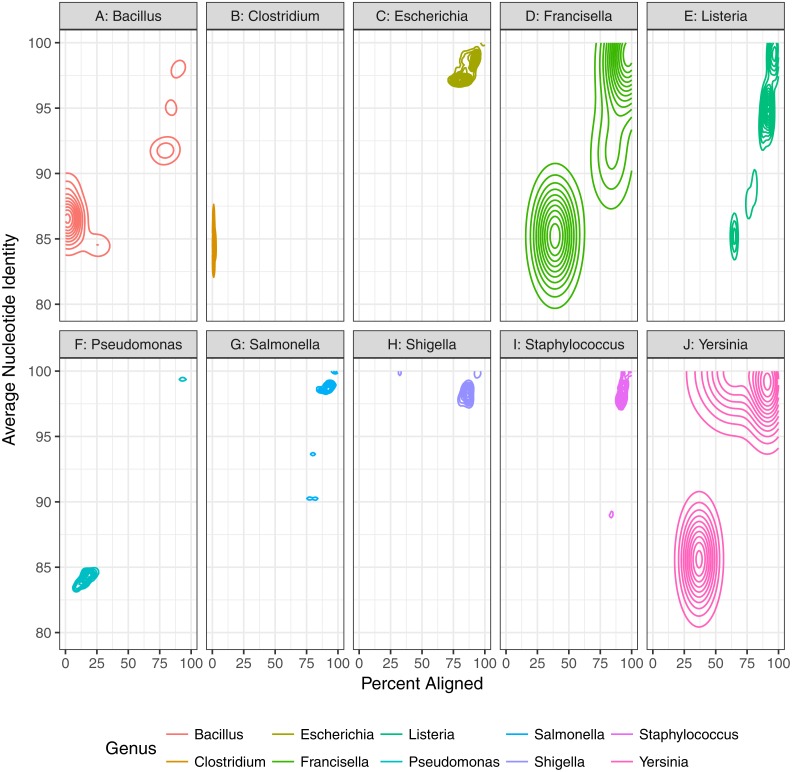
Figure 3. Genomic diversity of strains used in baseline study by genus.
The percent of the genome aligned is represented on the x-axis with average nucleotide identity (similarity of aligned regions) on the y-axis. More similar genomes will have a higher percent aligned and average nucleotide identity.

