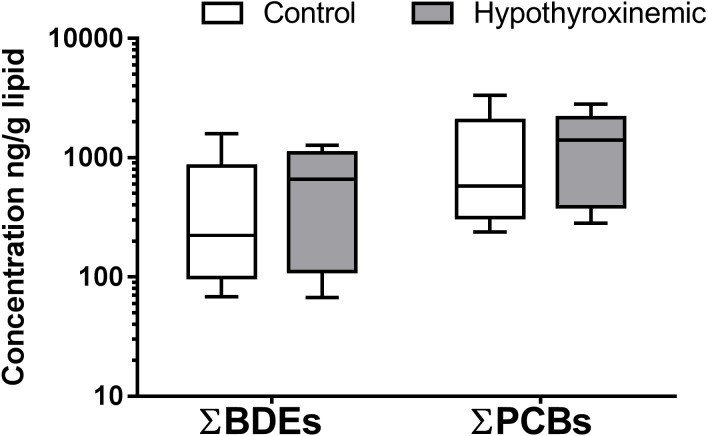
Figure 1. Box and whiskers diagram of ΣPBDEs and ΣPCBs concentrations in canine samples.
The distribution of measured concentrations are presented as ng/g lipid for control, N = 36, (white boxes) and hypothyroxinemic, N = 15, (gray boxes) canine samples. The upper and lower boundaries of the boxes represent the 75th and 25th percentiles, and the line within the boxes indicates the median value. The upper whiskers show the 90th and the lower whiskers the 10th percentile. Not all PBDEs and PCBs were detected above LOQ in all animals. For statistical purposes, values found below the LOD were assigned a value of LOD/2.

