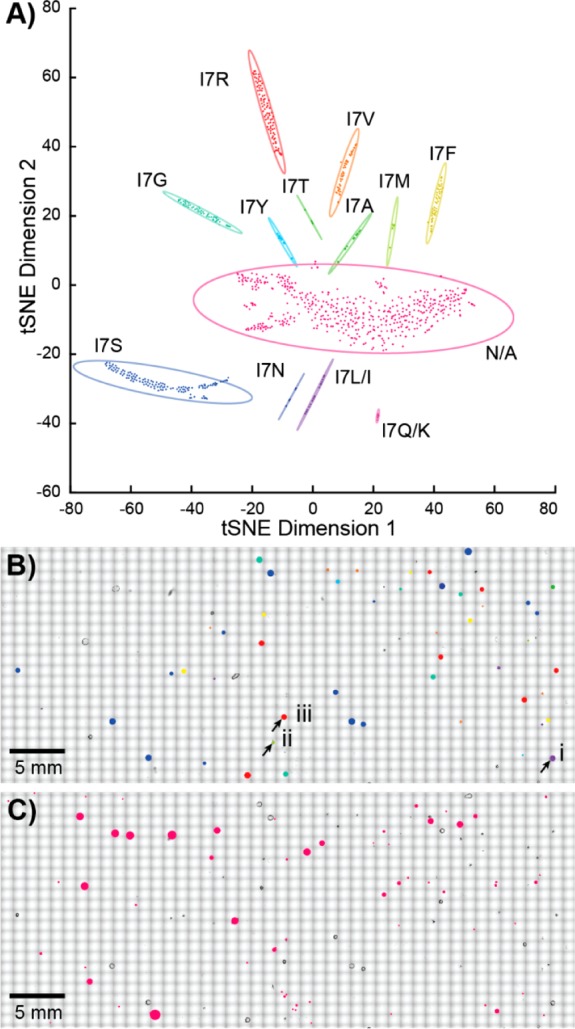
Figure 2.

Multivariate analysis of PZN analogues. (A) Visualization with targeted t-SNE clustering of the I7 library from a single experiment. Each point corresponds to a single mass spectrum, with each cluster surrounded by a 95% confidence ellipsoid. The N/A cluster contains spectra without observable peptide signals. The position of (B) each mutant or (C) N/A colony is mapped onto the optical image to aid mutant recovery. The three colonies highlighted in panel B are displayed in more detail in Figure 3.
