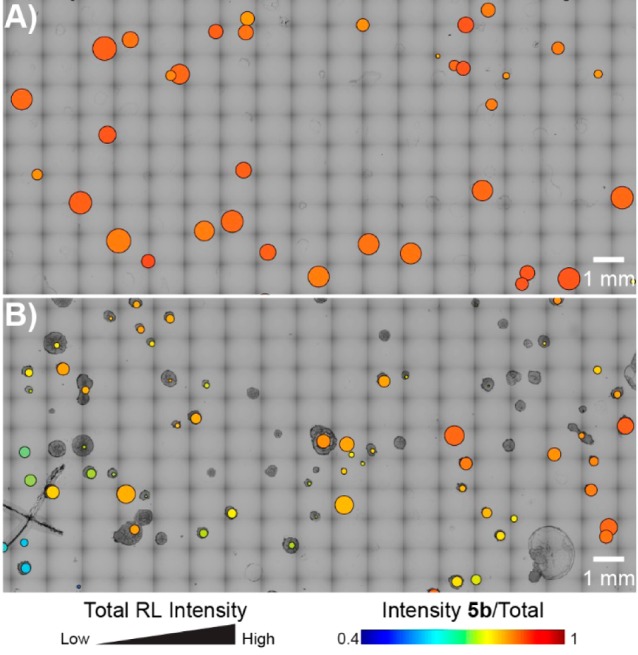
Figure 4.

Visualization of MALDI-ToF MS screening results of mono-RL-producing E. coli colonies. (A) WT. (B) Strain library in the first round of mutagenesis (R1). For each circle overlaying the corresponding colony, the radius scales with the log-base 10 intensity of the sum of all RL peaks, and the false color scales with the relative abundance of RL 5b. Only a small, representative region is shown.
