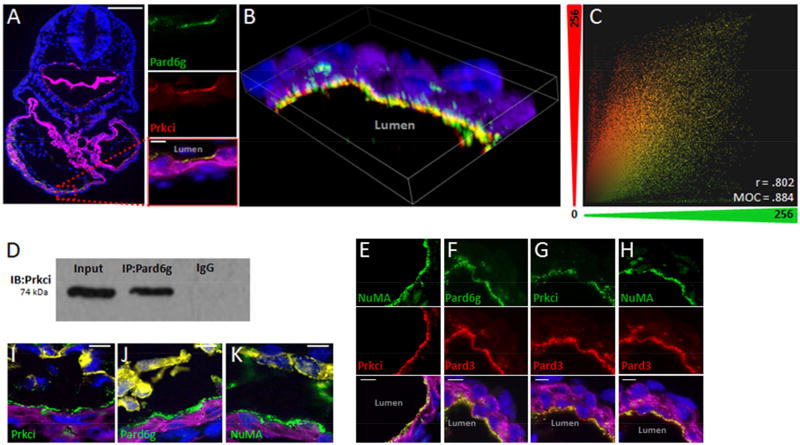
Figure 1. Luminal localization of Par complex members in early embryonic hearts.
A. E8.5 embryonic hearts co-stained for Pard6g (green), Prkci (red). B. Confocal microscopy showing co-localization of Pard6g and Prkci. C. A 2D scatter plot of fluorescence intensities in the green (x, Prkci) and red (y, Pard6g) channels was reconstructed from the 3-D image and the Manders Overlap Coefficient (MOC) and Pearson Correlation Coefficient (r) were calculated. This demonstrates significant co-localization of the red and green channels in three dimensions. D. Embryonic lysates were immunoprecipitated with anti-Pard6g antibody and then immunoblotted with anti-Prkci. E–H. Par complex members co-stained green or red as indicated. I–K Par complex members (green) co-stained with PECAM-1 (yellow, outlining the endocardium). TnT (purple) and DNA (DAPI, blue). Scale bars: 100µm zoom out, 10µm elsewhere.

