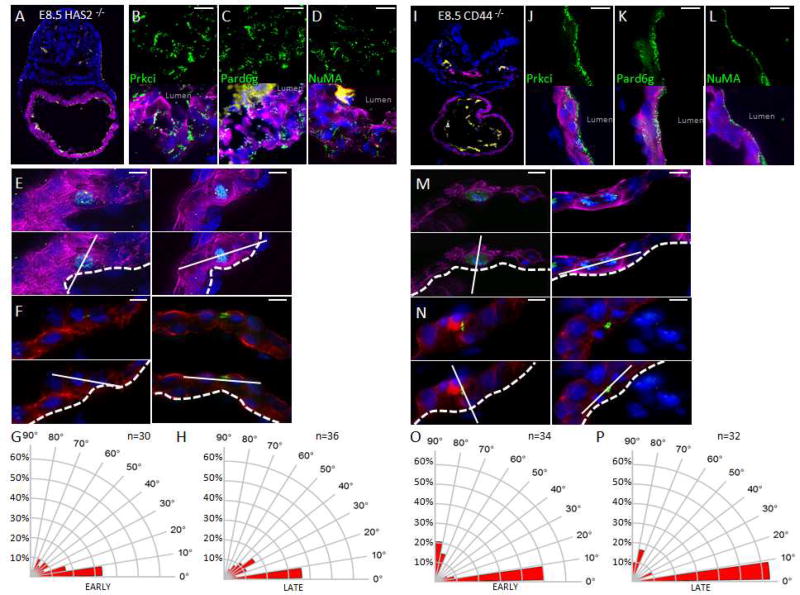
Figure 3. HA in the cardiac jelly is required for polarized cell division in E8.5 mouse hearts.
A. E8.5 HAS2−/− embryo co-stained for TnT (purple), PECAM-1 (yellow), and DAPI (blue). B–D. E8.5 HAS2−/− embryonic hearts stained in green for Prkci (B), Pard6g (C), or NuMA (D). E. Top panels: Representative images of early mitotic luminal cardiomyocytes in E8.5 HAS2−/− hearts co-stained for pHH3 (green), Pcnt (yellow), TnT (purple), and DAPI (blue). Lower panels: Superimposed axis of cell division (solid line) relative to the cardiac lumen (dashed line). F. Top panels: Representative images of luminal telophase cardiomyocytes in E8.5 HAS2−/− hearts co-stained for survivin (green), TnT (red), and DAPI (blue). Lower panels: Superimposed axis of cell division (solid line) relative to the cardiac lumen (dashed line). G. Radial histogram depicting the orientation of cardiomyocyte divisions in early-stage mitotic cells from E8.5 HAS2−/− hearts. H. Radial histogram depicting the orientation of cardiomyocyte divisions in late-stage mitotic cells from E8.5 HAS2−/− hearts. I. E8.5 CD44−/− embryo co-stained for TnT (purple), PECAM-1 (yellow), and DAPI (blue). J–L. E8.5 CD44−/− embryonic hearts stained in green for Prkci (J), Pard6g (K), or NuMA (L). M. Top panels: Representative images of early mitotic luminal cardiomyocytes in E8.5 CD44−/− hearts co-stained for pHH3 (green), Pcnt (yellow), TnT (purple), and DAPI (blue). Lower panels: Superimposed axis of cell division (solid line) relative to the cardiac lumen (dashed line). N. Top panels: Representative images of luminal telophase cardiomyocytes in E8.5 CD44−/− hearts co-stained for survivin (green), TnT (red), and DAPI (blue). Lower panels: Superimposed axis of cell division (solid line) relative to the cardiac lumen (dashed line). O. Radial histogram depicting the orientation of cardiomyocyte divisions in early-stage mitotic cells from E8.5 CD44−/− hearts. P. Radial histogram depicting the orientation of cardiomyocyte divisions in late-stage mitotic cells from E8.5 CD44−/− hearts. Scale bars: 100µm zoom out, 10µm elsewhere else. P values (P≤0.001 for early and late mitosis) determined by a chi-square test in G&H and O&P for determining significance of the difference between HAS2 null and wildtype cells. Chi-square P values related to G&H and O&P are in Table S1. n values in G&H and O&P represent the number of cells analyzed from 3 to 5 independent animals.

