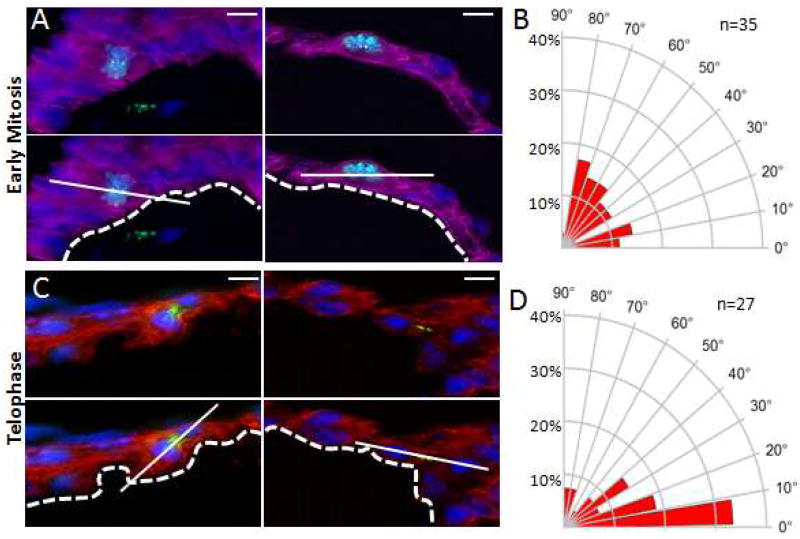
Figure 7. Luminal Cardiomyocyte Division Angles in E8.5 NuMA Cardiac Null Mouse Ventricles.
A. Top panels: Representative images of early mitotic luminal cardiomyocytes in E8.5 NuMA cardiac null hearts co-stained for pHH3 (green), Pcnt (yellow), TnT (purple), and DAPI (blue). Lower panels: Superimposed axis of cell division (solid line) relative to the cardiac lumen (dashed line). B. Radial histogram depicting the orientation of cardiomyocyte divisions in early-stage mitotic cells from E8.5 NuMA cardiac null hearts. C. Top panels: Representative images of luminal telophase cardiomyocytes in E8.5 NuMA cardiac null hearts co-stained for survivin (green), TnT (red), and DAPI (blue). Lower panels: Superimposed axis of cell division (solid line) relative to the cardiac lumen (dashed line). D. Radial histogram depicting the orientation of cardiomyocyte divisions in late-stage mitotic cells from E8.5 NuMA cKO hearts. Scale bars: 10µm. P values (P≤0.01 for early and P≤0.001 for late) determined by a chi-square test in B&D for determining significance of the difference between cardiac null and wildtype cells. Chi-square P values related to B&D are in Table S1. n values in B&D represent the number of cells analyzed from 3 to 5 independent animals.

