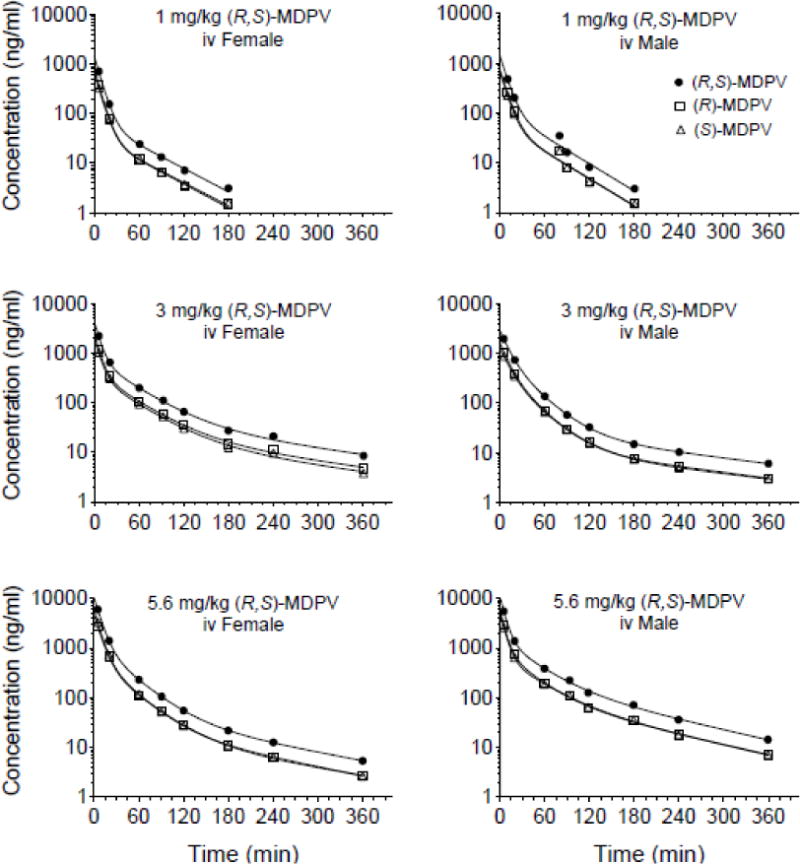
Fig. 3.

Serum concentration versus time curves of (S)-, (R)-, and (R,S)-MDPV from one animal representative of the average pharmacokinetics values after an iv bolus dose of 1, 3, or 5.6 mg/kg (R,S)-MDPV in female and male SD rats (n = 5–6 per group). Symbols denote observed concentrations. The best-fit solid lines in each plot were determined by model-dependent pharmacokinetic analysis. See Table 1 for comparison of pharmacokinetic values after the iv dosing.
