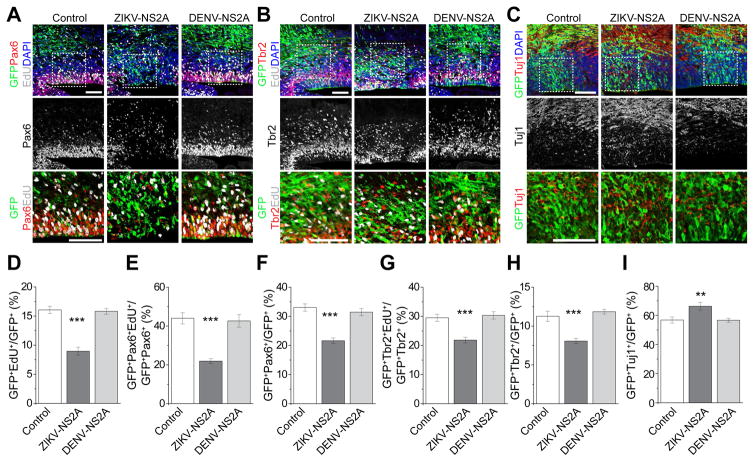
Figure 1. ZIKV-NS2A, but not DENV-NS2A, dysregulates radial glial cells in the embryonic mouse cortex.
Embryonic mouse cortex was electroporated at E14.5 to express GFP, GFP and ZIKV-NS2A, or GFP and DENV-NS2A, followed by EdU labeling 2 hr before analysis at E17.5. Sample confocal images of immunostaining for Pax6 (A), Tbr2 (B), Tuj1 (C) and GFP, and staining for EdU and DAPI are shown. Scale bars: 100 μm (A, B, C). The regions in white boxes (top panels) are shown at a higher magnification (bottom panels). Quantifications are also shown (D–I). Values represent mean + SEM (n = 5–7 sections from 3–4 animals; ***: P < 0.001; **: P < 0.01; One-way ANOVA).
Also see Figure S1 and S2.

