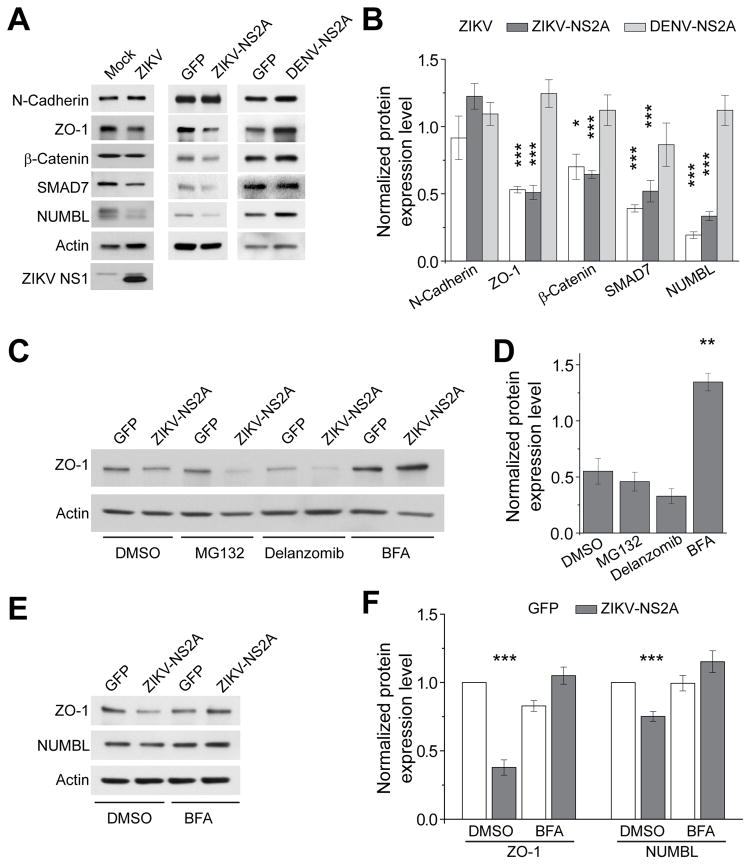
Figure 4. ZIKV-NS2A, but not DENV-NS2A, expression leads to adherens junction complex component degradation.
(A–B) Sample western blot images of expression levels of adherens junction complex components in mouse neural progenitors infected with ZIKV, expressing ZIKV-NS2A, or expressing DENV-NS2A (A), and quantifications (B). Data were normalized to that of mock infection for the ZIKV infection condition, or to that of GFP expression alone for the ZIKV-NS2A or DENV-NS2A conditions. Values represent mean + SEM (n = 3 cultures; ***: P < 0.001; *: P < 0.05; Student’s t-test).
(C–D) Sample western blot images of expression levels of ZO-1 upon 24 hr treatment of DMSO, MG-132 (20 μM), Delanzomib (60 nM) and BFA (100 nM) in HEK293 cells expressing GFP and ZIKV-NS2A, or GFP alone (C), and quantifications (D). Data were first normalized to actin expression levels and then to the data from expression of GFP alone. Values represent mean + SEM (n = 3 cultures; **: P < 0.01; Student’s t-test).
(E–F) Sample western blot images of expression levels of ZO-1 and NUMBL upon 24 hr treatment of DMSO, or BFA (100 nM) of mouse cortical neural progenitors expressing GFP and ZIKV-NS2A, or GFP alone (E), and quantifications (F). Data were normalized to that of actin. Values represent mean + SEM (n = 3 cultures; ***: P < 0.001; Student’s t-test).
Also see Figure S4.

