
Figure 1.
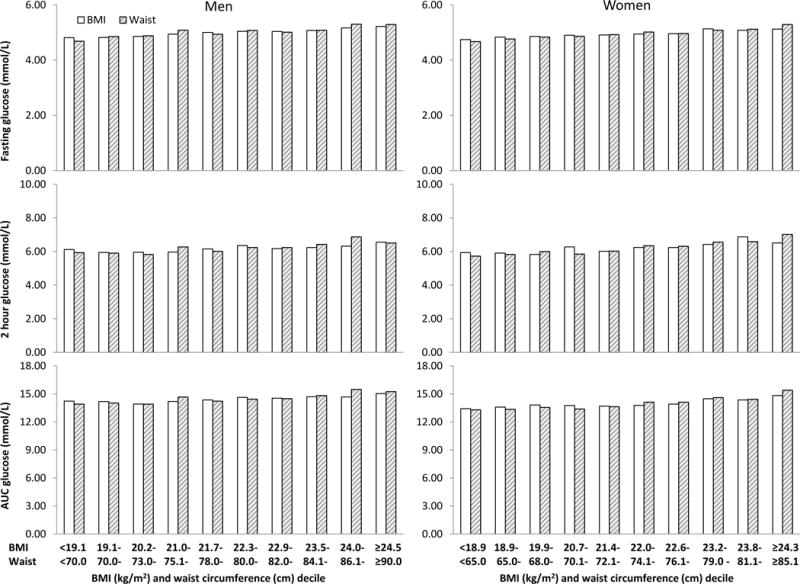
Least square mean levels of fasting glucose, 2 hour glucose, and area under the curve (AUC) glucose adjusted for age, education, leisure-time physical activity, alcohol drinking, family history of type 2 diabetes by BMI or waist circumference decile and sex. P for trend <0.01 in all cases.