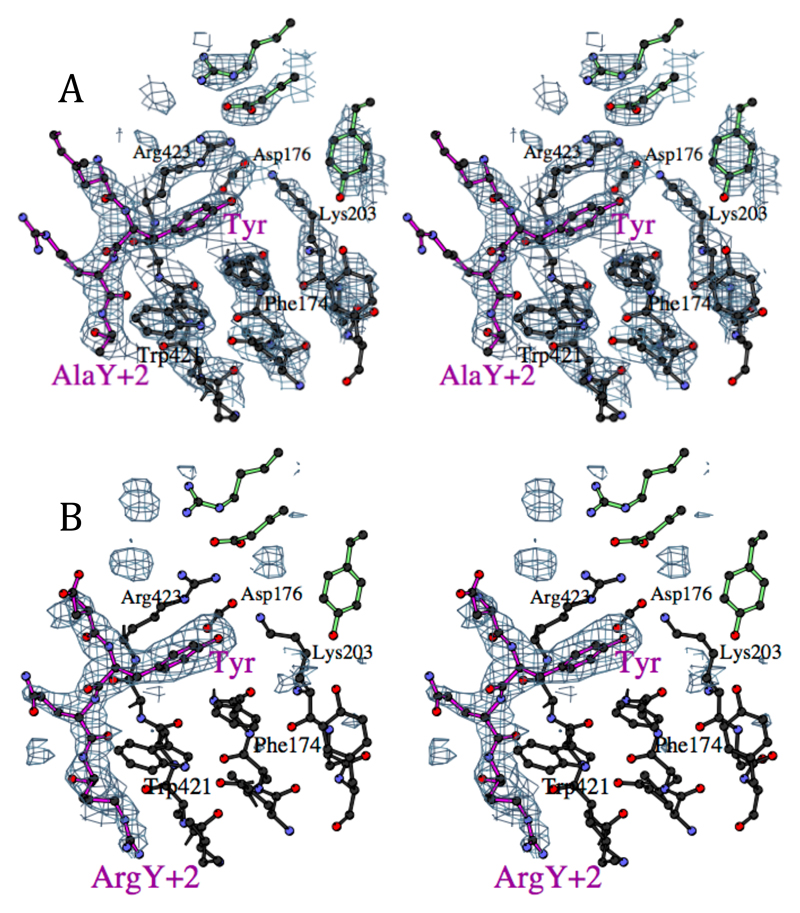
Figure 2.
A Stereo view of the binding site for the tyrosine residue in the EGFR internalisation signal FYRALM, showing part of the experimental electron density map, with phases calculated using the peptide complex data as native with the Xe and EMTS derivatives, and solvent flattening with a 70% solvent content. The peptide is represented with magenta bonds, and the residues at the top right with green bonds come from the other subunit in the crystallographic dimer. (Figures drawn with BOBSCRIPT (32))
B Stereo view of the binding site for the TGN38 internalisation signal DYQRLN, in the same view as D. The difference electron density shown was calculated using the model from the FYRALM peptide structure with the peptide removed: density for the arginine in the Y+2 position is clearly visible, packed against Trp421.

