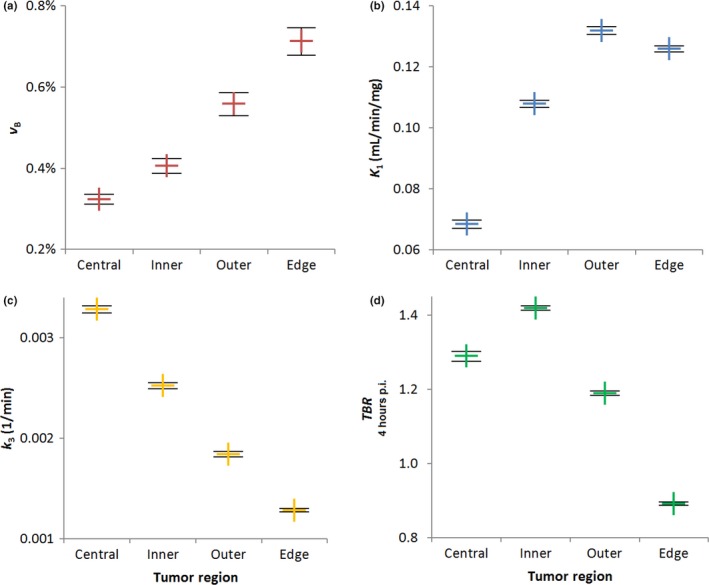
Figure 6.

Variation with distance from the tumor edge of weighted mean values of (a) v B, (b) K 1, (c) k 3, and (d) TBR parameters for all patients pre‐Buparlisib. Error bars show standard errors on the mean. [Color figure can be viewed at wileyonlinelibrary.com]
