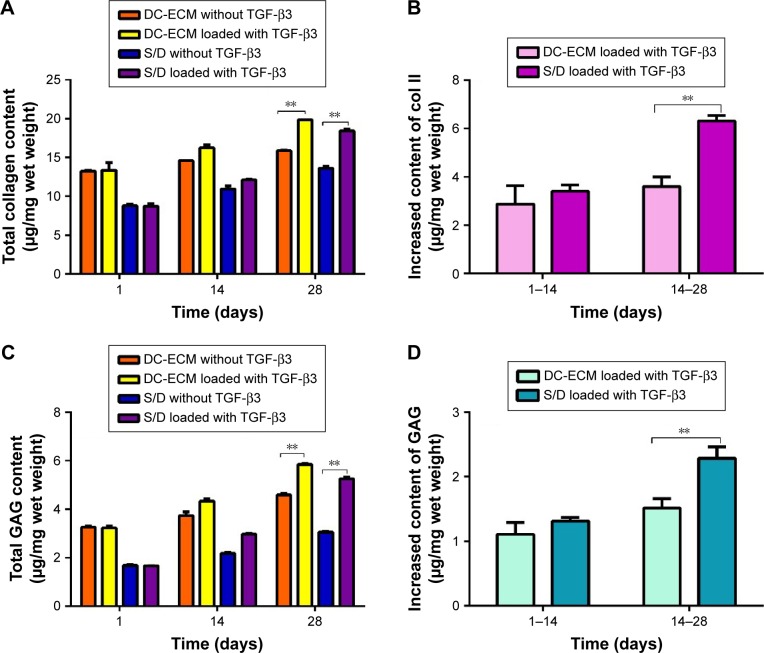
Figure 4.
Quantitative analysis of collagen and GAG content in cell-scaffold constructs.
Notes: Content of (A) total collagen and (B) collagen with TGF-β3 loading after 14 and 28 days of culture. Content of (C) total GAG and (D) GAG with TGF-β3 loading after 14 and 28-day culture. Data are mean ± SD, n=4. **P<0.01.
Abbreviations: GAG, glycosaminoglycan; S/D, hybrid composite scaffold of silk fibroin and DC-ECM; TGF-β3, transforming growth factor β3.

