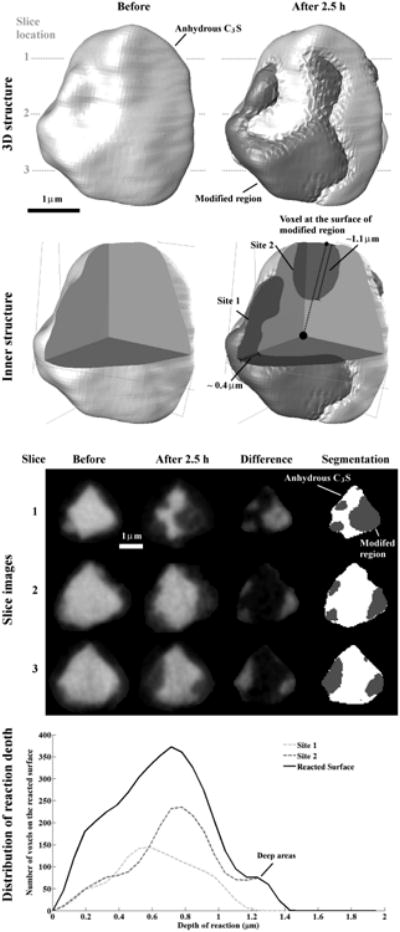
Fig 4.

The nCT datasets of Particle 1 showing before and after 2.5 h of reaction with the 3D outer and inner structure, typical cross sections, and the distribution of reaction depths. The modified regions is a darker gray and the anhydrous C3S is lighter. These results show that certain regions of the particle show higher amounts of reaction while still maintaining the original particle border.
