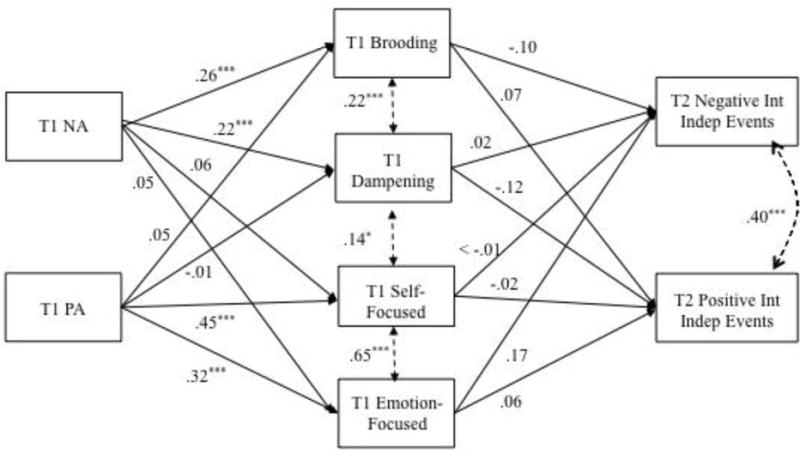
Figure 2.

Path coefficients from affect, responses to affect, and positive and negative interpersonal independent stressors.
Note. Standardized path coefficients are presented in the figure. Dotted lines are covariances. NA = Negative Affect, PA = Positive Affect; Int = Interpersonal; Indep = Independent. Additional paths were included between each variable in the model, but are not included in the figure for ease of interpretation. Time 1 depressive symptoms, BAS status, sex, and race were also covaried in all analyses when predicting all dependent variables.
