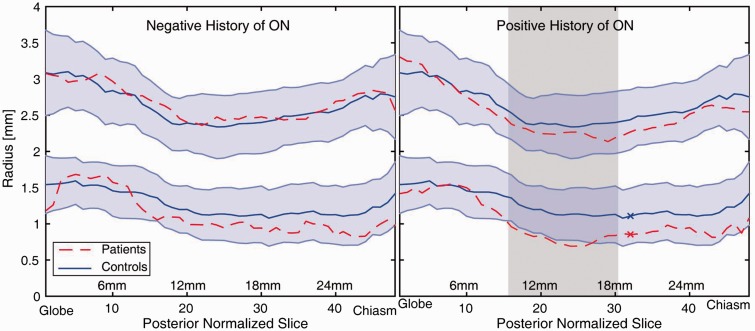
Figure 3.
Comparison of volumes of optic nerves never affected by optic neuritis (ON) (left) and optic nerves with a previous history of ON (right) to healthy controls. The upper distribution is the diameter of the sub-arachnoid cerebrospinal fluid while the lower line is the radius of the optic nerve. The shaded blue region indicates one standard deviation of the healthy control population. The shaded region (right) illustrates the region of 15 consecutive measurements (9 mm) where the patients’ nerves are significantly smaller than healthy nerves (Wilcoxon rank-sum; p < 0.05 Bonferroni corrected). The nerves from patients with a negative history of ON were not significantly different from healthy controls.

